Mixed stands of trembling aspen and white spruce are a prominent component of our western boreal forests. Despite the fact that aspen can slow the growth of white spruce, there are a number of advantages to managing mixedwoods, as compared to converting to monocultures. Advantages can include: higher total yields, reduced incidence of frost damage to spruce, reduced vigor of understory competitors, and higher spruce wood quality. Long-term site productivity may also be enhanced by the presence of aspen, which takes up nutrients and retains them on site. Maintaining mixed stands in landscapes where they are naturally common, as is the case in Canada’s western boreal forests, also contributes to sustainable forest management objectives such as preserving biodiversity, protecting wildlife habitat, and preserving visual characteristics in the landscape.
Despite the advantages to managing for mixed stand types, this does involve added complexity. Improving our understanding of stand dynamics and growth in these complex stand structures is important to accurately predicting outcomes from mixedwood management practices. The Western Boreal Growth and Yield Association, which became the WESBOGY Project Team of FGrOW, recognized this need and began to establish a Long-term Study (LTS) in 1990 to advance our understanding of the dynamics of spruce/aspen mixedwood stands. Today, the study includes a total of 615 plots established across British Columbia, Alberta, Saskatchewan, Manitoba and the Northwest Territories.
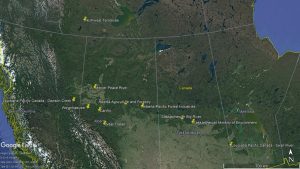
Figure 1. Locations of WESBOGY LTS Installations.
Overview
This study involved planting white spruce seedlings in recently clearcut areas where aspen regeneration had already been established. Five years after planting, spruce and aspen were thinned to desired treatment densities (Table 1). Each installation consists of two replications of 15 treatments. Measurement plots are 20m by 20m (0.04 ha) with a 5–10m wide treated buffer on each side of the measurement plot. Trees are measured annually for the first 10 years of the study, every 2 years between ages 10 and 20, and then every three or four years. Collected data are all stored in a database that is maintained on a secure server at the University of Alberta.
Table 1. Treatment numbers for the 15 spruce and aspen density combinations created in the WESBOGY LTS.
| Aspen Density (#/ha) | |||||||
| 0 | 200 | 500 | 1500 | 4000 | Natural | ||
| Spruce Density (#/ha) | 1000 | 1 | 2 | 3 | 4 | 5 | 6 |
| 500 | 7 | 8 | 9 | 10 | 11 | 12 | |
| 0 | x | x | x | 13 | 14 | 15 | |
Table 2. Agencies and installation establishment dates.
| Company or Agency | Agency Code | Site | Year Spruce Established |
| Alberta Agriculture and Forestry | AAF | Med | 1992 |
| Alberta-Pacific Forest Industries Inc. | ALP | High
Med |
1994
2001 |
| Canadian Forest Products Ltd. | CFR | High
Med |
2000
2001 |
| Mercer Peace River | MPR | High
Med |
1992
1992 |
| Louisiana-Pacific Canada Ltd., Manitoba | LPSR | High
Med |
1998
1998 |
| Louisiana-Pacific Canada Ltd., Dawson Creek | LPDC | High
Med |
2001
2004 |
| Northwest Territories Resources, Wildlife and Economic Development | NWT | High
Med |
1993
1993 |
| Alberta Plywood | WFR | High
Med |
1992
1993 |
| Weyerhaeuser Company, Alberta Forestlands | WGP | High
Med |
1991
1991 |
| Saskatchewan Ministry of Environment | SK PA | High
Med |
1990
1990 |
| Wood Fibre Centre, Canadian Forest Service | CFS BR | High
Med |
1992
1992 |
Selected Results:
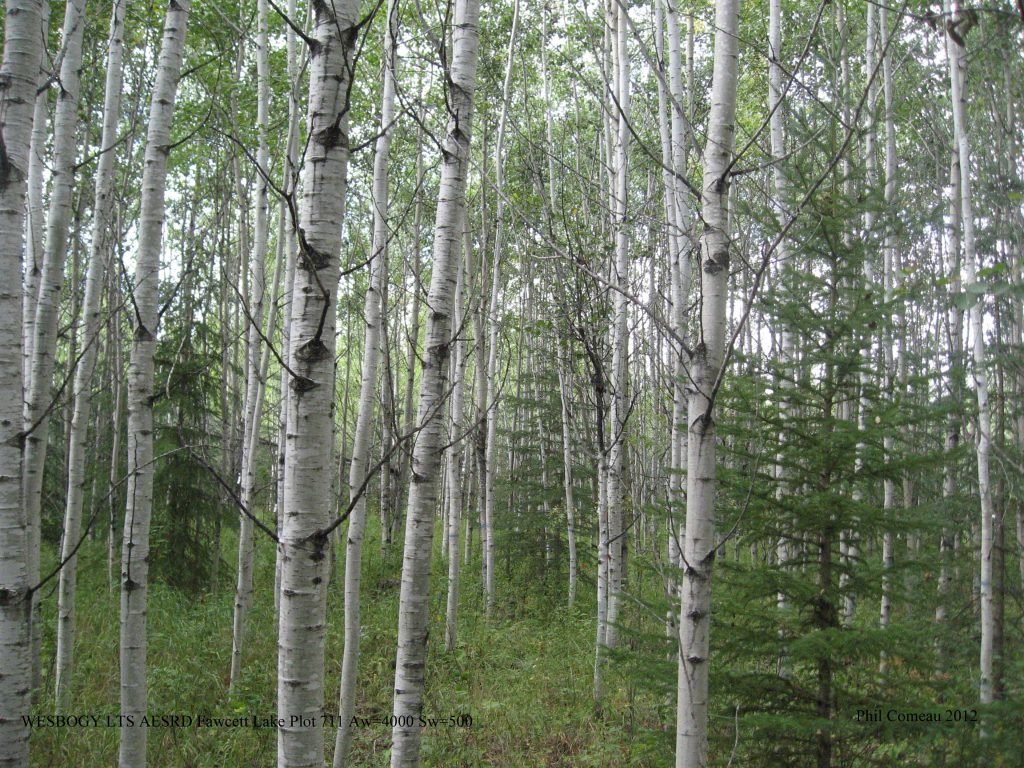
At age 20, (15 years after thinning) aspen heights are similar across treatments, but are smaller in the 200 sph treatment than in the 4000 or natural. Aspen diameter at breast height (DBH) and crown width (CW) decrease, while slenderness and height to live crown (HTLC) increase with increasing aspen density (Table 3).
Table 3. Effects of aspen density on aspen at 15 years after thinning. Values represent the averages of the top trees (100 largest DBH per hectare) for the 8 oldest LTS installations. The lower case letters following the parameter estimates represent the results of a Tukey’s test on means. Parameters with the same letter within each column are not significantly different.
| Treatment Density | HT | DBH | Slenderness | CW | HTLC |
| 200 | 12.28b | 16.14a | 0.77d | 2.16a | 3.17d |
| 500 | 13.03ab | 16.04a | 0.82d | 2.23a | 3.76c |
| 1500 | 13ab | 14.86b | 0.88c | 1.85b | 4.24c |
| 4000 | 13.3a | 13.89b | 0.96b | 1.7b | 5.25b |
| Natural | 13.3a | 11.31c | 1.2a | 1.39c | 6.04a |
Thinning Effect of aspen on spruce 20 years after establishment
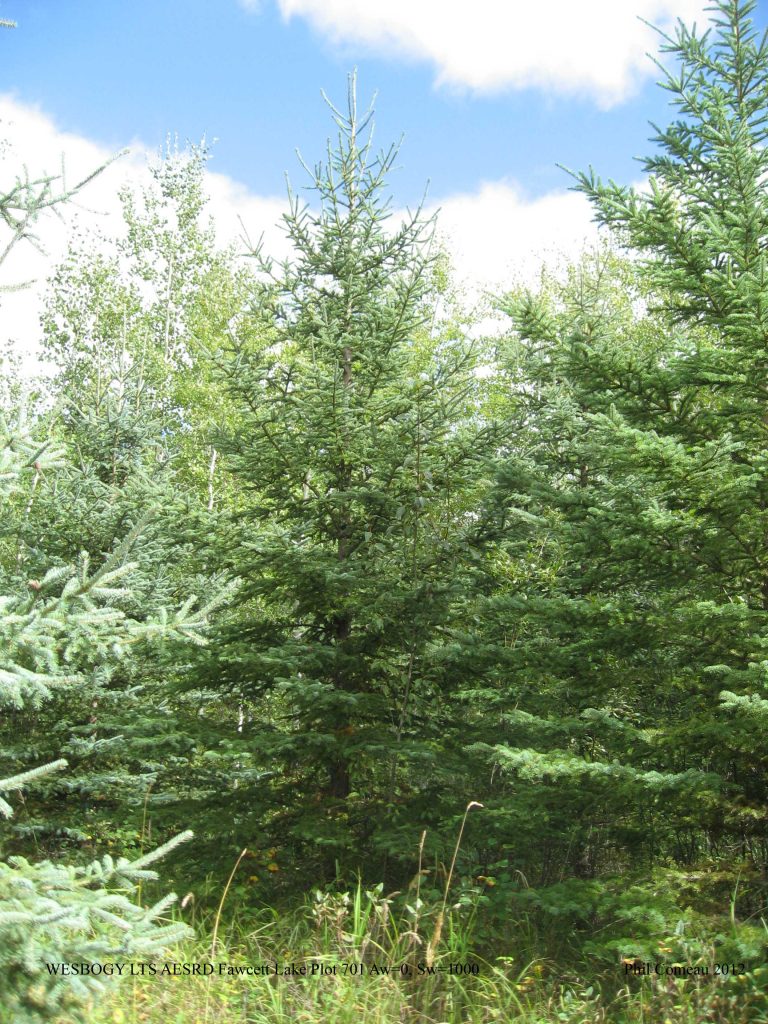
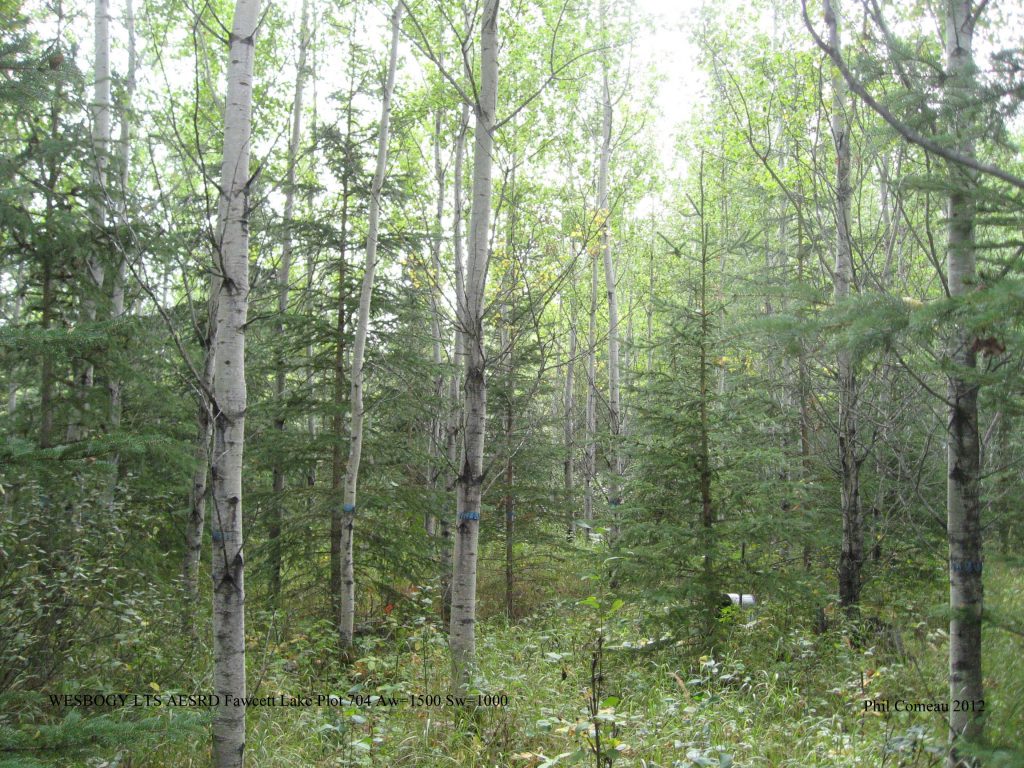
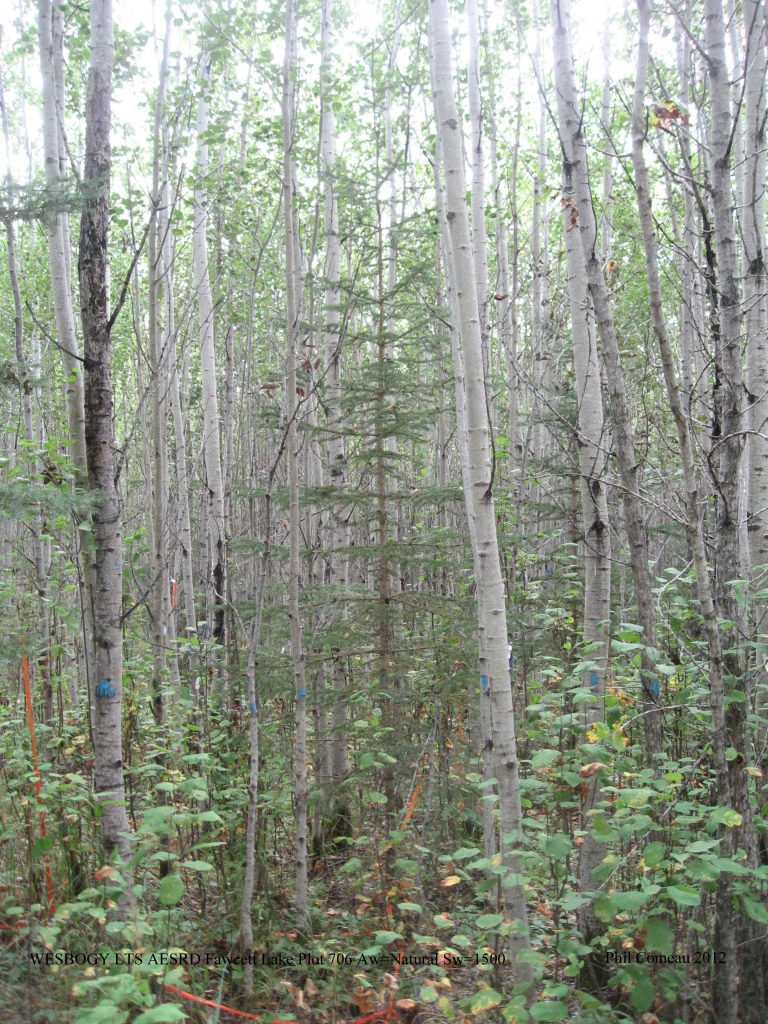
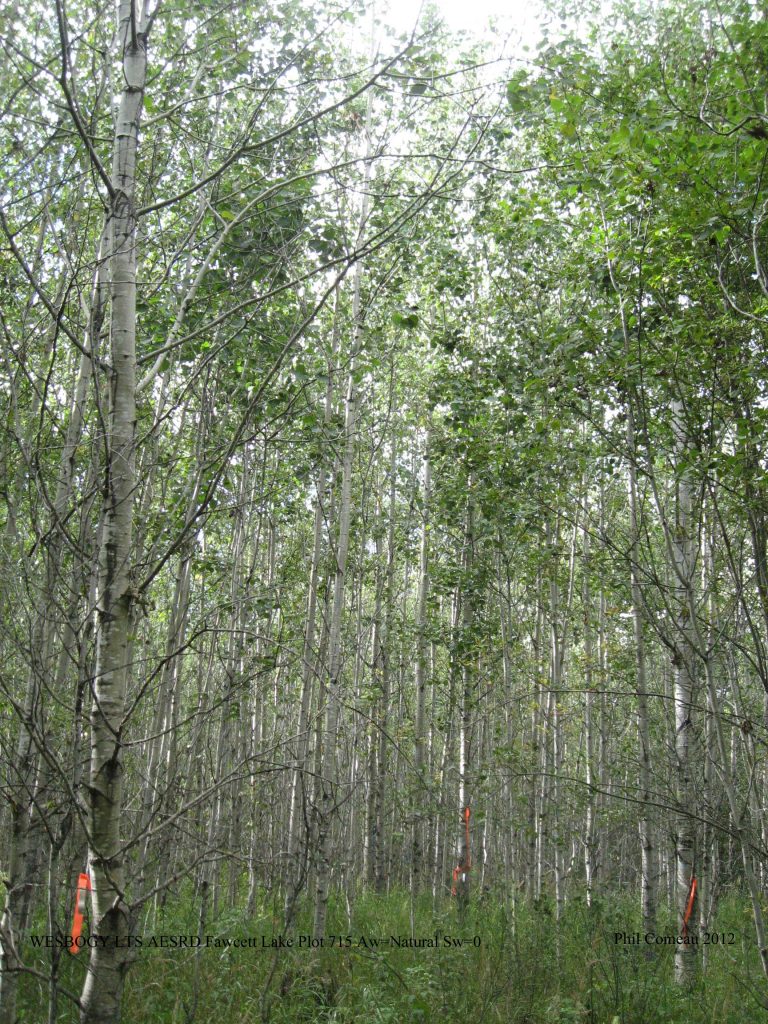
Results 15 years after thinning show that aspen has significant effects on spruce size, with spruce in the unthinned natural plots having the smallest height and DBH (table 4). At age 20, spruce height, DBH and crown width decrease with increasing aspen density while slenderness and height to live crown increase with increasing aspen density. Slenderness and DBH show the strongest response to aspen density. Reductions in crown width with increasing aspen density are linked to reductions in branch diameter and, together with an increase in height to live crown with increasing aspen density, could lead to reductions in the number and size of knots on the lower stem of these trees as they mature. Figure 1 shows the effect of aspen density on spruce growth and form.
Table 4. Effects of aspen density on spruce at age 20, 15 years after thinning. Values represent the averages of the top trees (100 largest DBH sph) for the 8 oldest LTS installations. The lower case letters following the parameters represent the results of a Tukey’s test on means. Parameter estimates with the same letter within each column are not significantly different.
| Aspen Density | Height (m) | DBH (cm) | Slenderness | Crown Width (m) | Height to Base of Live Crown (m) |
| 0 | 5.79a | 9.22a | 0.67e | 1.28a | 0.55b |
| 200 | 5.67ab | 8.80a | 0.73de | 1.30a | 0.57b |
| 500 | 5.66ab | 8.01b | 0.76d | 1.23ab | 0.59ab |
| 1500 | 5.31bc | 6.86c | 0.84c | 1.16bc | 0.61ab |
| 4000 | 4.93c | 5.84d | 0.92b | 1.07c | 0.64a |
| Natural (unthinned) | 3.89d | 4.29e | 1.04a | 0.87d | 0.67a |
Analysis of data from the Long-Term Study is ongoing. LTS installations cover a wide range of climatic conditions and are distributed widely across the western boreal forest. Continued monitoring of these installations, coupled with monitoring of climatic conditions on site (with instrumentation being installed in connection with the CFI funded SmartForests project in 2019 and 2020) will provide valuable information on the impacts of climate change on these stands. In addition information on the effects of interactions between climate and tree densities on tree and stand responses will provide potentially valuable information to guide strategies for adapting these forests to climate change. The study also provides long term tree level data needed for the development and testing of growth models like MGM.
For more information contact:
Long Term Study, c/o Dr. Robert Froese
Dept. of Renewable Resources
751 General Services Building
University of Alberta
Edmonton, Alberta T6G 2H1
mixedwood.long.term.study@ualberta.ca
PC April 22, 2020